► Saab’s Results January-June 2019
Saab presents the results for January-June 2019.
Statement by the President and CEO Håkan Buskhe:
Sales growth remains strong and operating margin improved
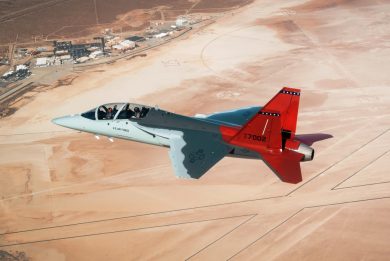
During the first half of 2019, Saabs sales increased by 8 per cent and the operating margin improved. Saab continues to drive internationalisation of the business and several steps were taken in the first half of the year to strengthen the local presence. A clear example of this is the decision to establish a new U.S. development and production facility in West Lafayette, Indiana, where Saab will manufacture its parts for the T-X advanced jet trainer ordered by the U.S. Air Force.
Orders
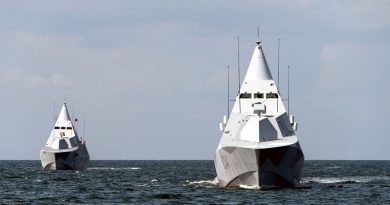
Order bookings during the first half of 2019 amounted to SEK 9.7 billion (12.7). During the period, an order was received from the U.S. Coast Guard for the Sea Giraffe Multi Mode Radar, and the United Kingdom Royal Navy ordered an anti-submarine training system. The business area Dynamics saw continued strong demand. Two major framework agreements were signed for the Carl-Gustaf multi-purpose weapon system and AT4 disposable weapon system.
Small orders increased strongly compared to the same period in 2018. Market demand remains strong and during the remaining part of the year, Saab see substantial business opportunities.
Sales and operating income
Sales in the first half year amounted to SEK 16,941 million (15,719) with organic growth of
7 per cent. The increase in sales is primarily related to higher level of deliveries within business area Dynamics and a higher activity level within business area Industrial Products and Services.
Operating income amounted to SEK 1,221 million (905) with an operating margin of 7.2 per cent (5.8). Measures taken to increase productivity contributed to improved margin in the period. Saab has a strong focus on securing delivery of milestones in major projects. The HMS Gotland was relaunched in the second quarter, which means that two of Sweden’s Gotland-class submarines have now concluded comprehensive mid-life upgrades. Development and production of the Gripen E fighter continued according to plan and during the period a third aircraft performed its first flight.
Efforts to adapt the product portfolio, increase marketing efficiency and accelerate the pace of automation and digitisation in operations continues.
Operational cash flow
Operational cash flow amounted to SEK -2,702 million (-2,750). Cash flow was negative mainly due to increased working capital within the business area Aeronautics, where preparations for the first deliveries of Gripen E to Brazil and Sweden continue.
Saab expects operational cash flow to be negative for the full-year 2019, but at a better level than 2018. Operational cash flow will continue to be affected during the year by timing differences in payments for major projects with a high activity level.
Outlook statement
We estimate that sales growth in 2019 will be in line with Saab’s long-term financial goal: annual organic sales growth of 5 per cent.
The operating margin in 2019, excluding material non-recurring items, is expected to improve compared to 2018, bringing Saab a step closer to its long-term financial goal: an operating margin of 10 per cent per year over a business cycle.
Financial highlights
| MSEK |
Jan-Jun 2019 |
Jan-Jun 2018 |
Change, % |
Q2 2019 |
Q2 2018 |
Full year 2018 |
|
| Order bookings |
9,710 |
12,664 |
-23 |
5,228 |
6,529 |
27,975 |
|
| Order backlog |
94,236 |
104,473 |
-10 |
102,184 |
|||
| Sales |
16,941 |
15,719 |
8 |
8,445 |
7,953 |
33,156 |
|
| Gross income |
3,788 |
3,537 |
7 |
1,937 |
1,799 |
7,764 |
|
| Gross margin, % |
22.4 |
22.5 |
22.9 |
22.6 |
23.4 |
||
| EBITDA |
1,893 |
1,323 |
43 |
974 |
669 |
3,182 |
|
| EBITDA-margin, % |
11.2 |
8.4 |
11.5 |
8.4 |
9.6 |
||
| Operating income (EBIT) |
1,221 |
905 |
35 |
630 |
458 |
2,266 |
|
| Operating margin, % |
7.2 |
5.8 |
7.5 |
5.8 |
6.8 |
||
| Adjusted operating income |
1,221 |
905 |
35 |
630 |
458 |
2,564 |
|
| Adjusted operating margin, % |
7.2 |
5.8 |
7.5 |
5.8 |
7.7 |
||
| Net income |
826 |
450 |
84 |
429 |
199 |
1,366 |
|
| Of which Parent Company’s shareholders’ interest |
831 |
425 |
96 |
433 |
183 |
1,313 |
|
| Earnings per share after dilution, SEK 1) |
6.20 |
3.65 |
3.23 |
1.57 |
11.21 |
||
| Return on equity, % 2) |
10.5 |
9.7 |
8.1 |
||||
| Operational cash flow |
-2,702 |
-2,750 |
-779 |
-539 |
-2,424 |
||
| Free cashflow |
-3,126 |
-3,192 |
-989 |
-781 |
-3,195 |
||
| Free cashflow per share after dilution, SEK |
-23.32 |
-27.38 |
-7.38 |
-6.70 |
-27.27 |
||
| 1) Average number of shares after dilution |
134,064,875 |
116,563,375 |
134,039,937 |
116,610,780 |
117,144,915 |
||
| 2) Return on equity is measured over a rolling 12-month period | |||||||
For reading the full document please click here